Press Kit: World Electricity Figures for 2025
The world generated 31,678 TWh of electricity in 2025. This page collects the headline figures from Ember's annual statistics, each with its year named, a citation format to copy, links for reusing our charts and data, and share images for the world, the ten largest countries and the largest grid operators.
Headline figures, Ember 2025
- The world generated 31,678 TWh of electricity in 2025.
- Nuclear and renewables supplied 42.5% of world electricity in 2025.
- Power sector emissions were 14,545 MtCO2 in 2025.
- Poland grew its solar generation fastest of any large grid to 2025: 1.96 TWh in 2020 to 19.5 TWh in 2025.
- Vietnam grew its wind generation fastest of any large grid to 2025: 980 GWh in 2020 to 14.4 TWh in 2025.
- Ethiopia had the lowest carbon intensity of any country generating at least 10 TWh in 2025, 23 gCO2/kWh.
- Uzbekistan had the highest carbon intensity of any country generating at least 10 TWh in 2025, 1,000 gCO2/kWh.
Figures at a glance
Ember annual statistics, 2025Large grids means countries generating at least 10 TWh in the year shown. Growth is measured over five years and ignores grids starting from almost nothing.
How to cite
Please cite the page you used and link to it. A citation carries the site name, the page title and address, the source line printed at the foot of that page, and the as-of date shown on the page. There is no contact address: cite and link, and no permission is needed for the figures under the source's licence.
Format
Example, using Ember figures for 2025
To cite this page itself, use https://worldpowermonitor.com/press/ with the source line below.
Reuse charts and data
- Embeddable grid widgets: copy an iframe for the latest hourly demand and generation mix of a grid operator. Keep the source line in the frame.
- Data downloads: CSV and JSON files for generation, demand and carbon intensity, each with its source and licence.
- JSON API: static, open and free, for pulling the same figures into your own charts.
- Country pages carry an "Embed this chart" panel under their charts where a chart is cleared for reuse.
Share images
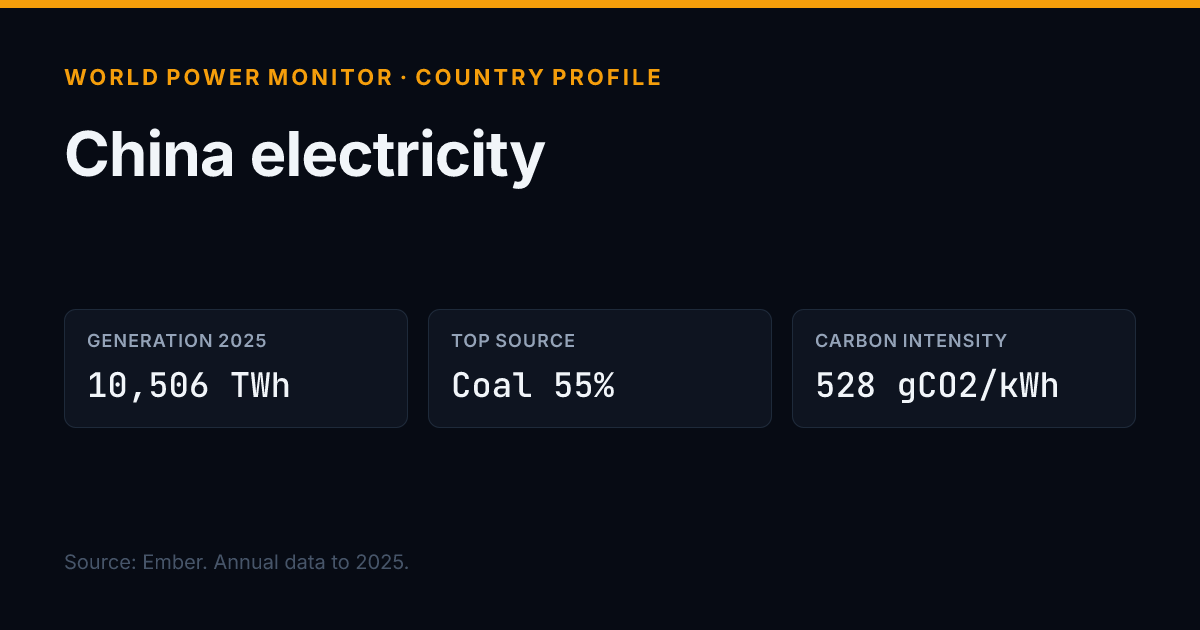
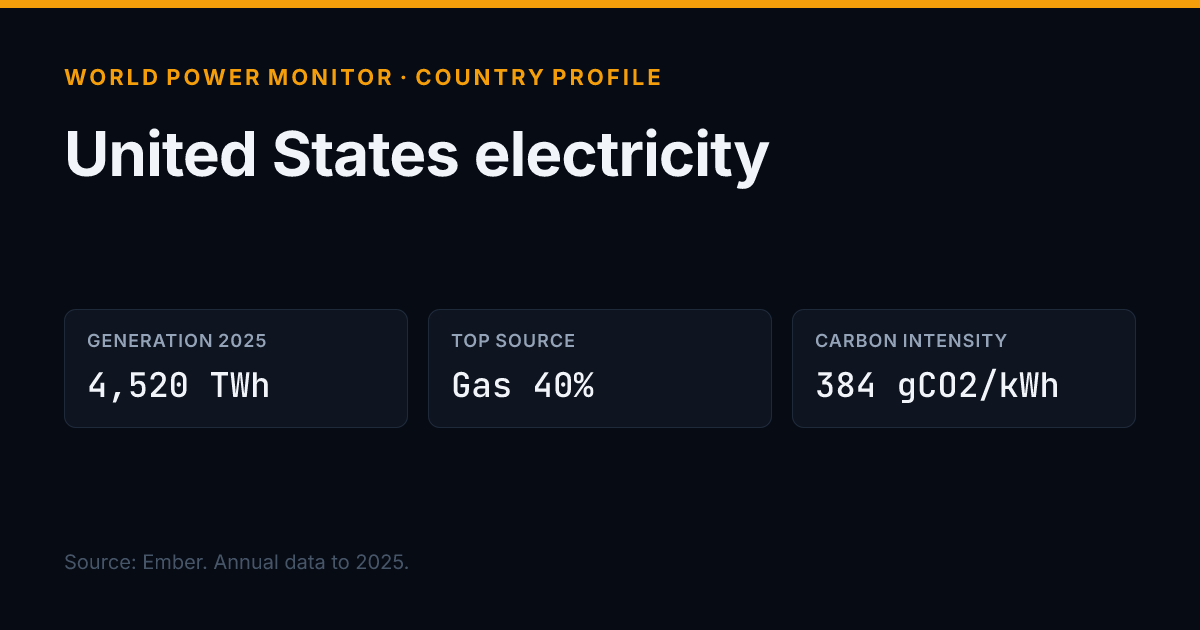
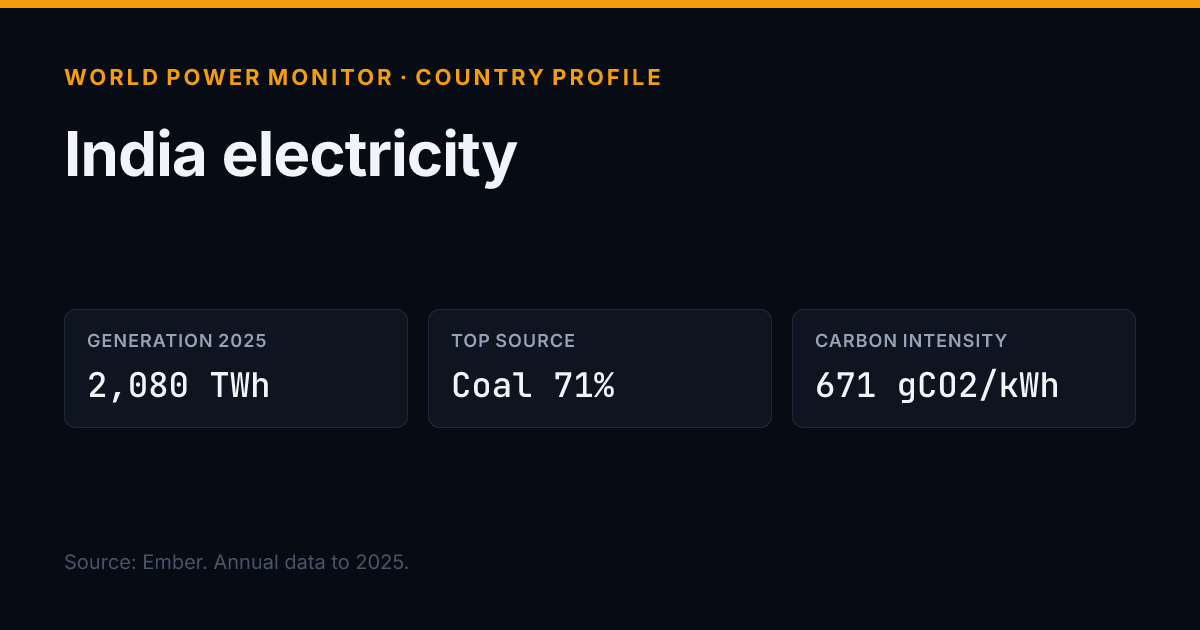
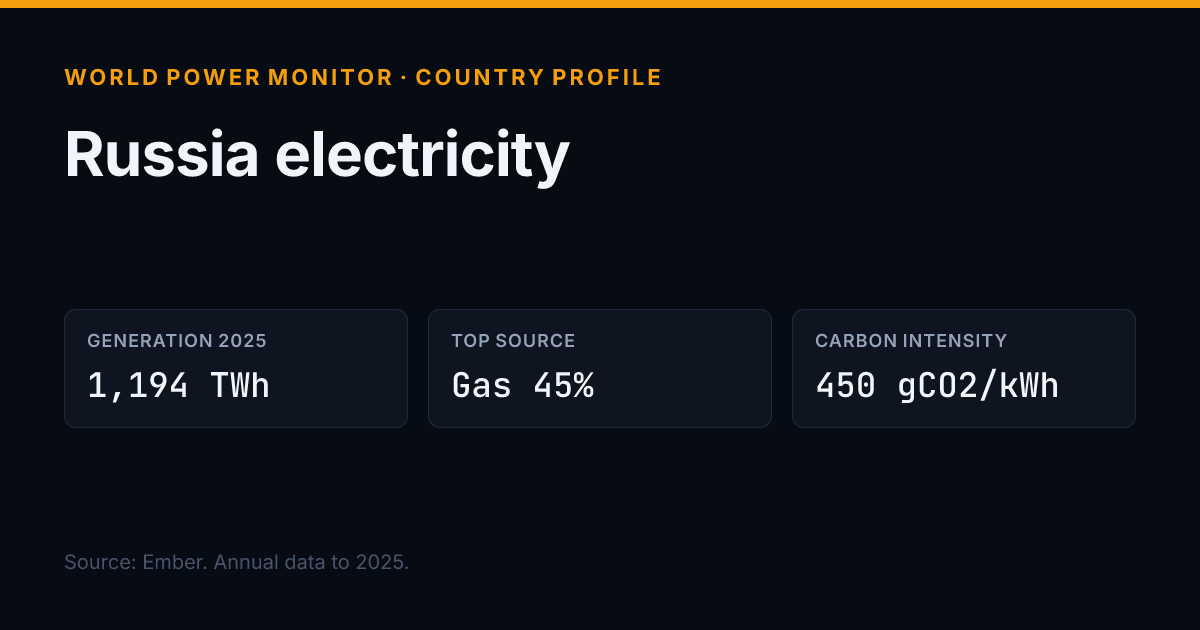
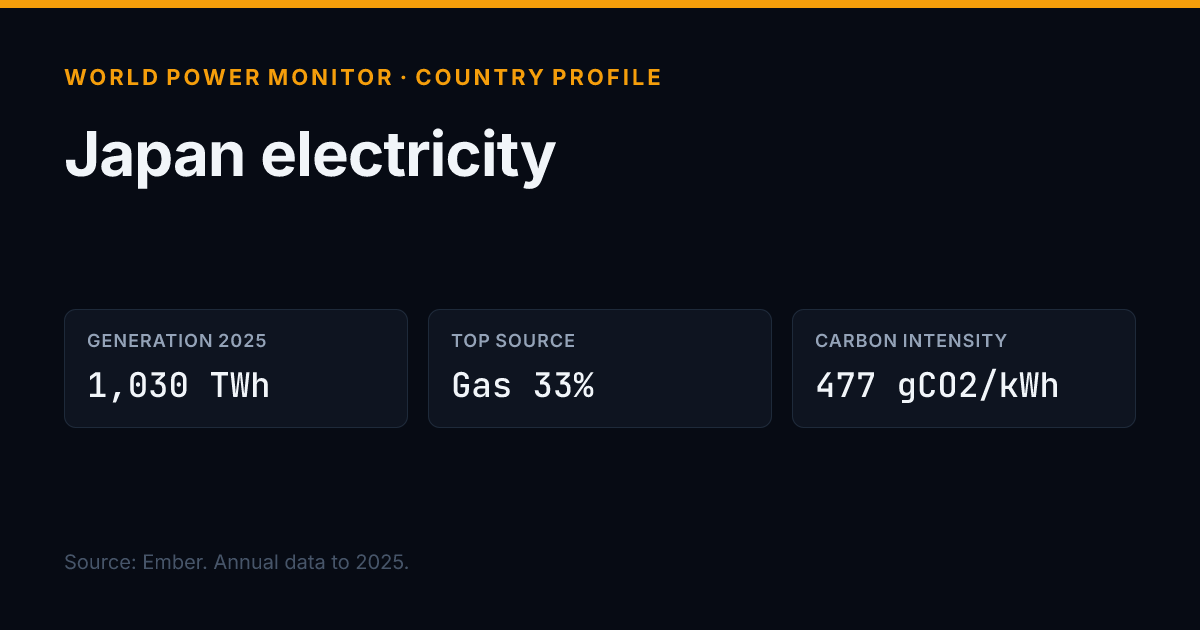
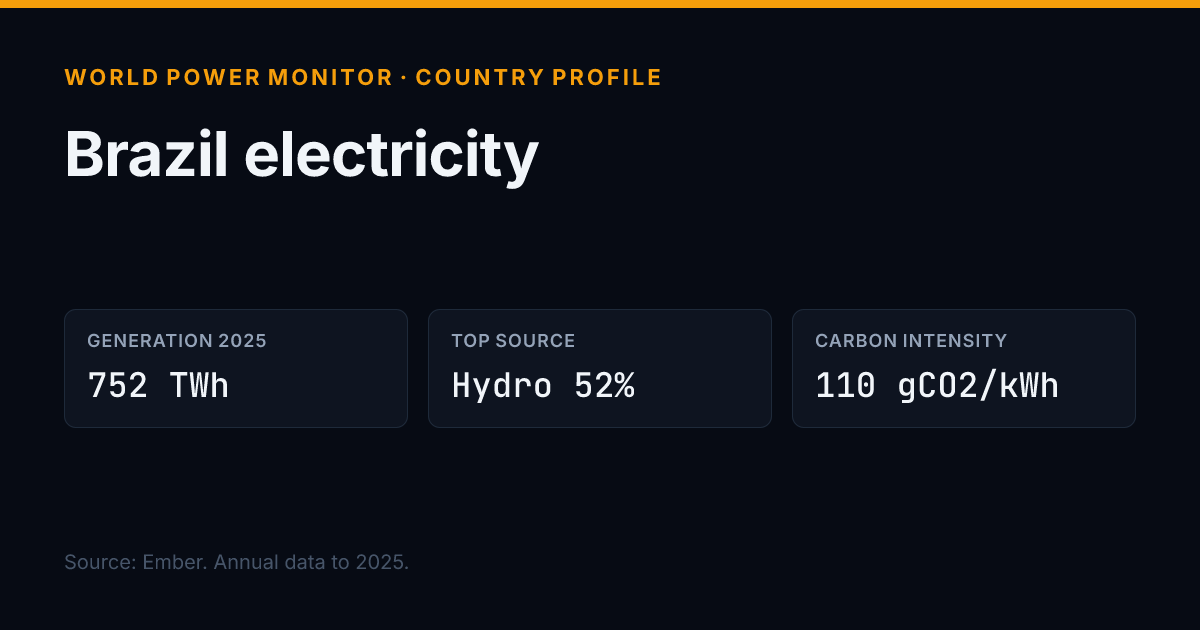
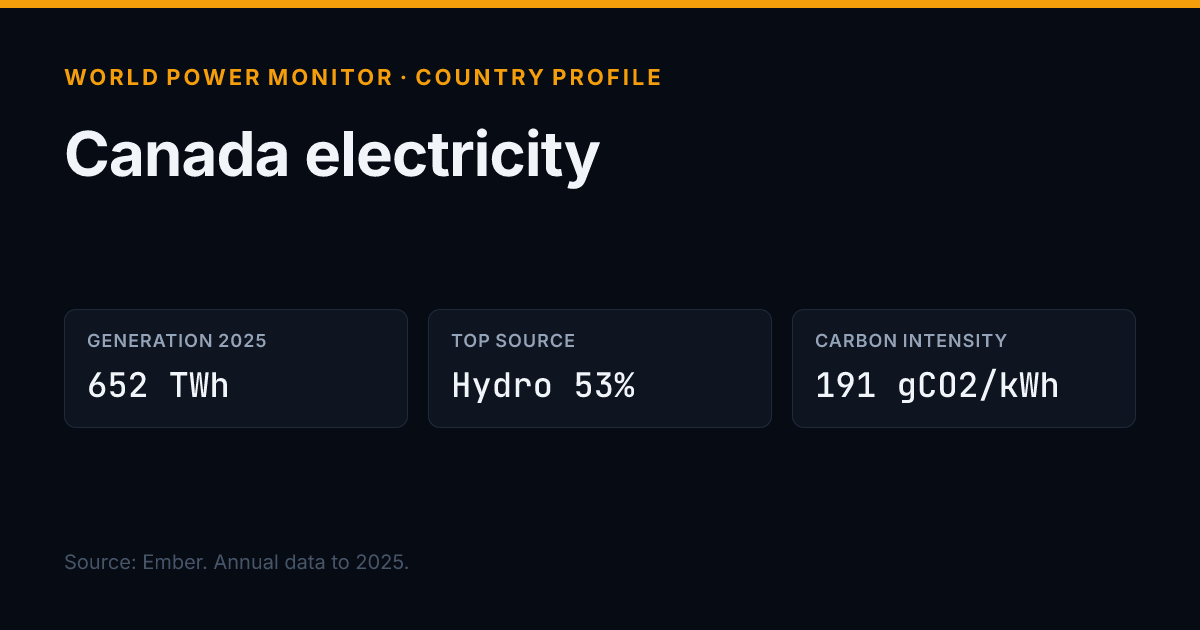
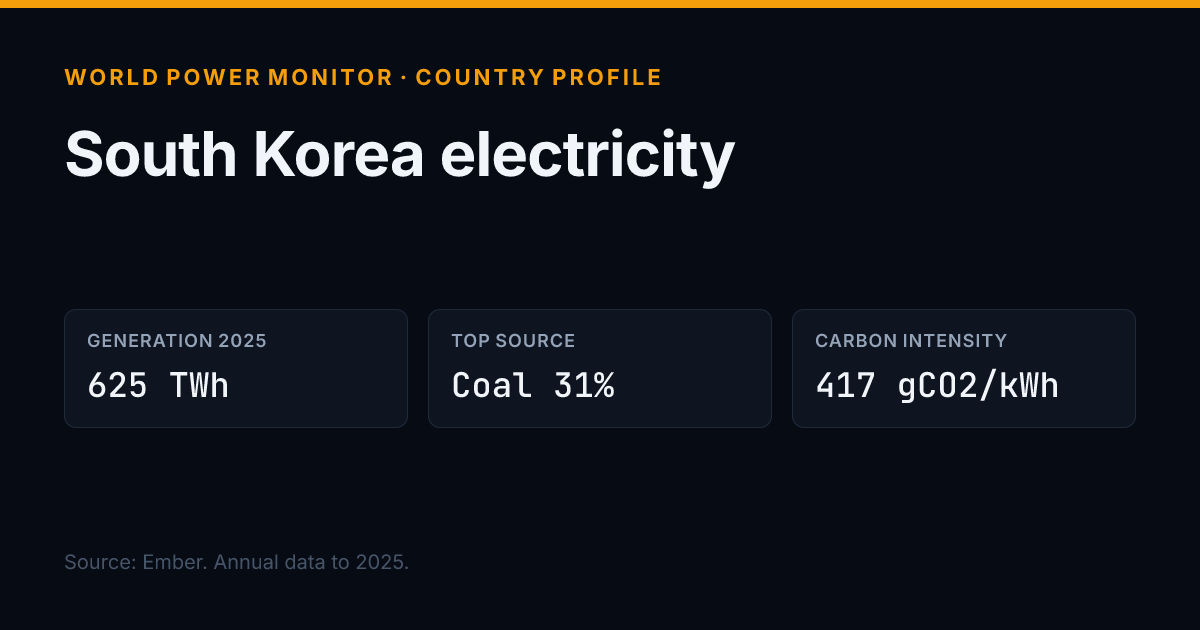
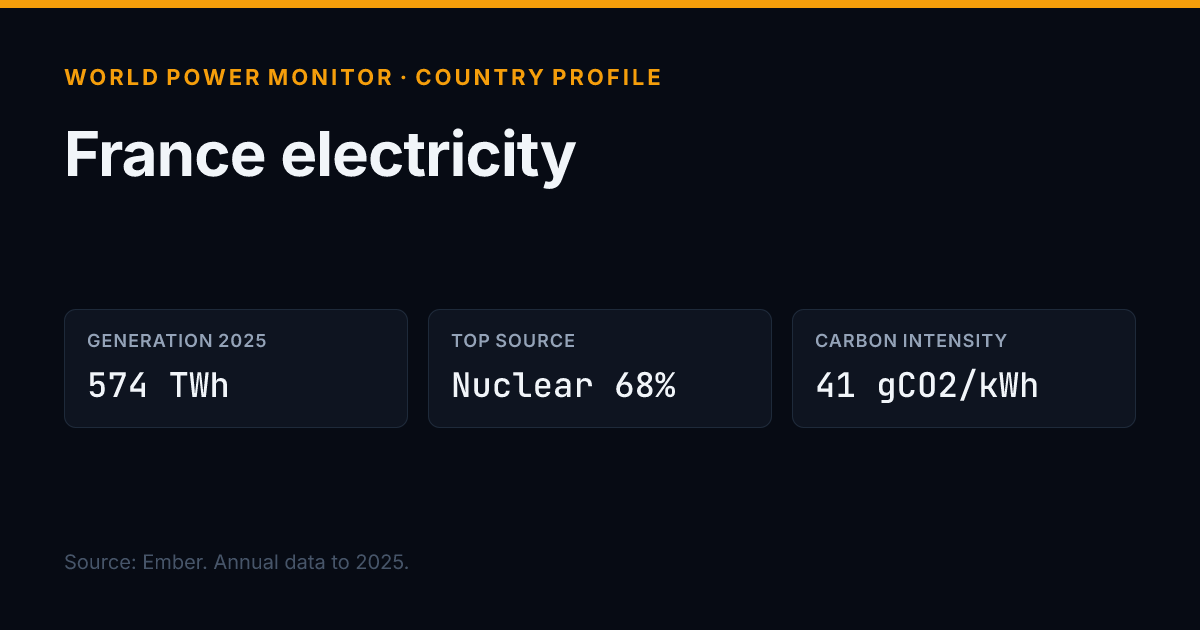
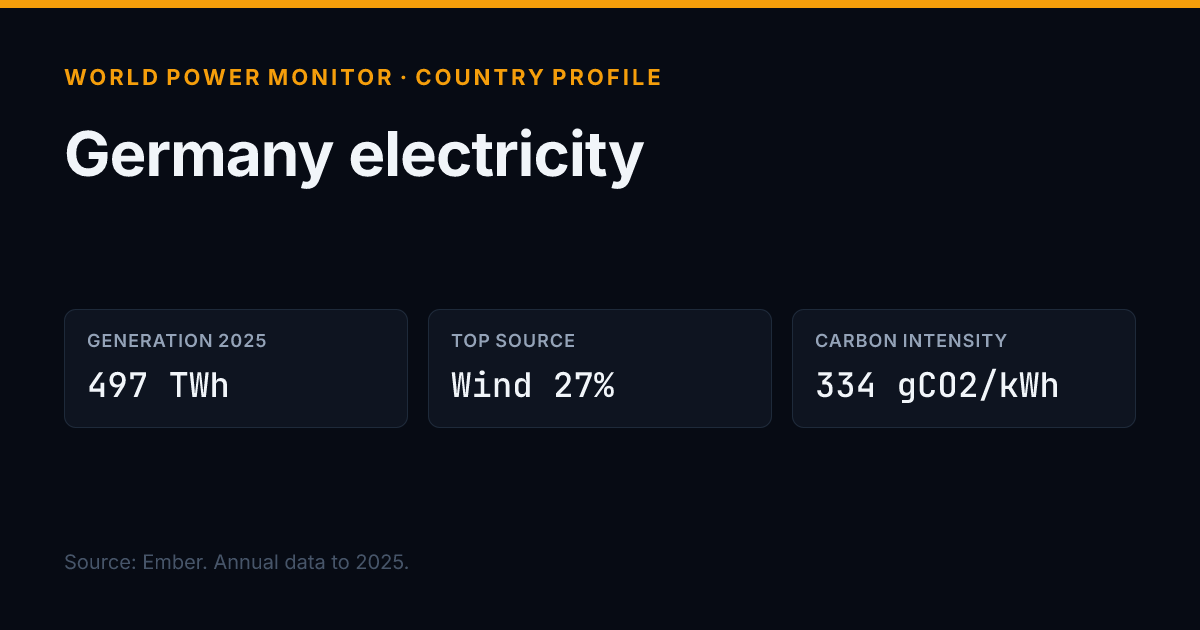
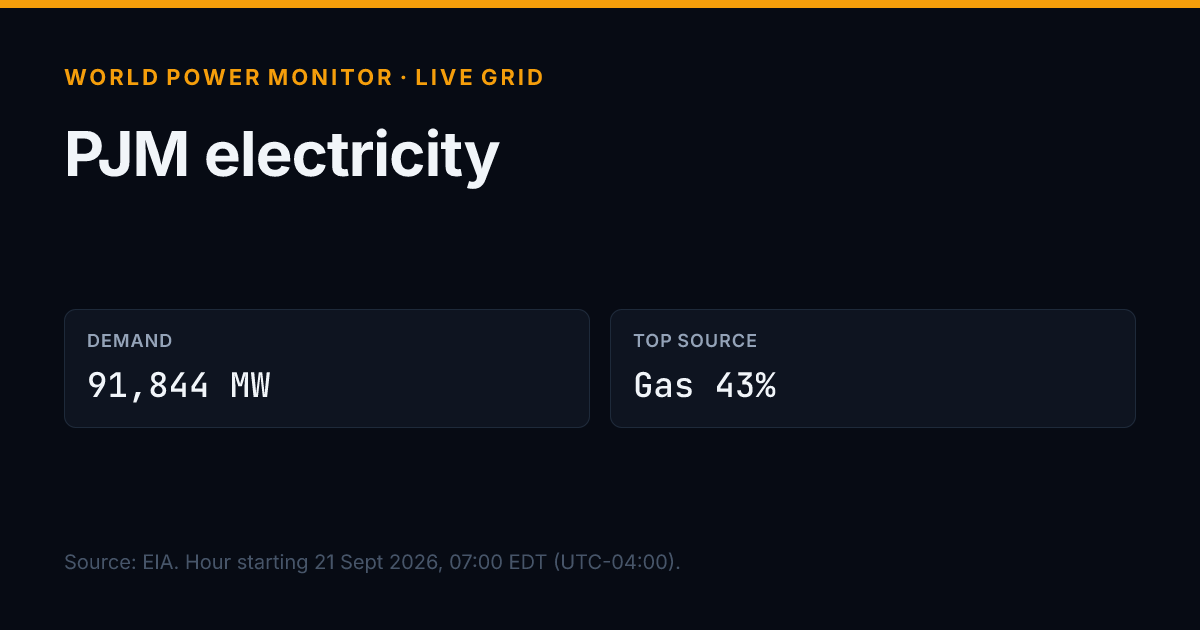
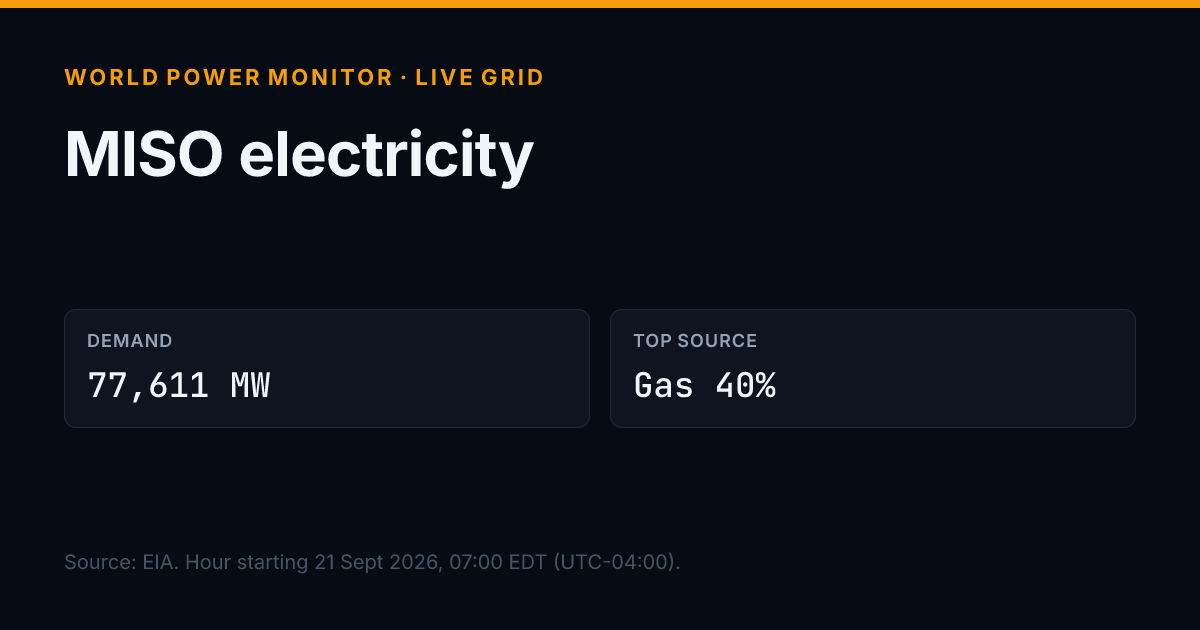
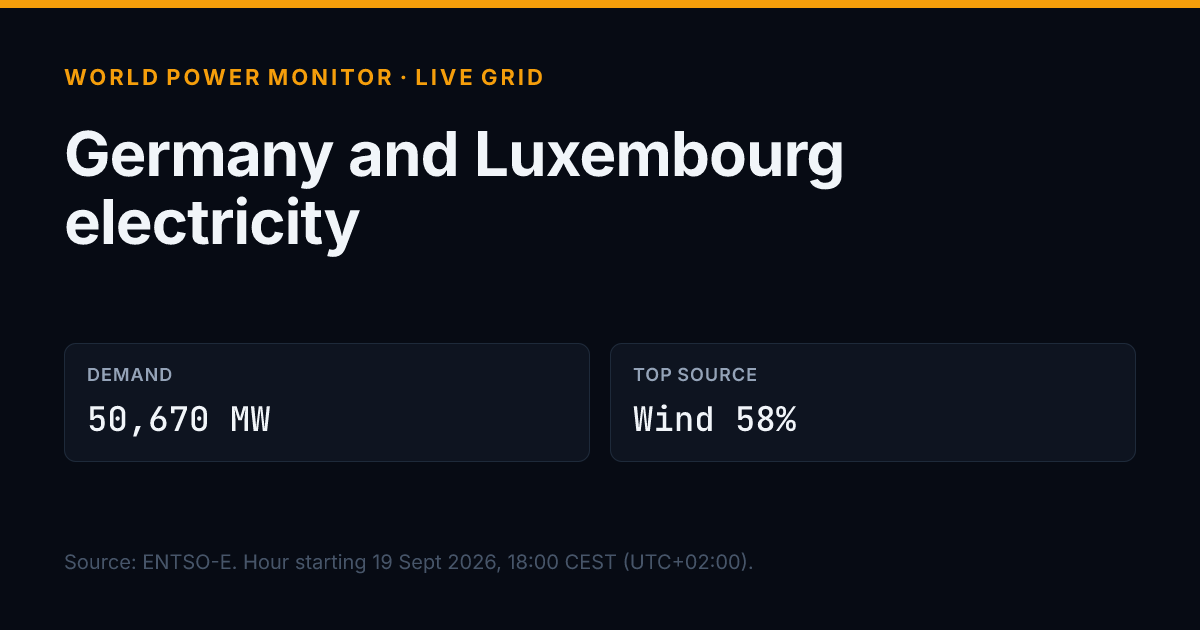
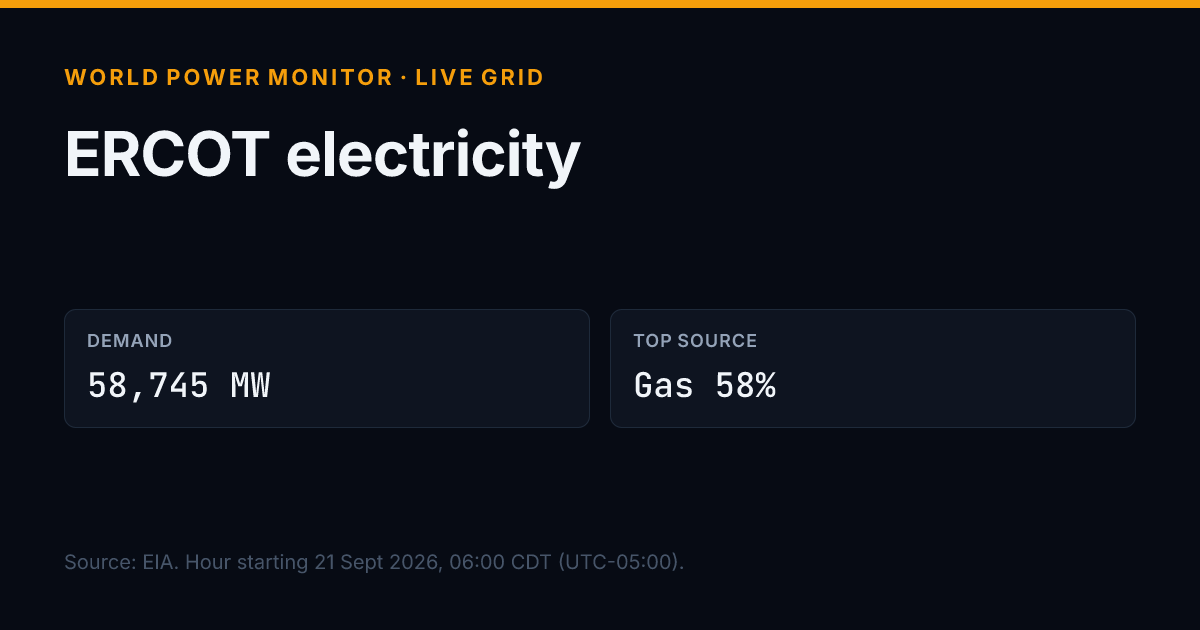
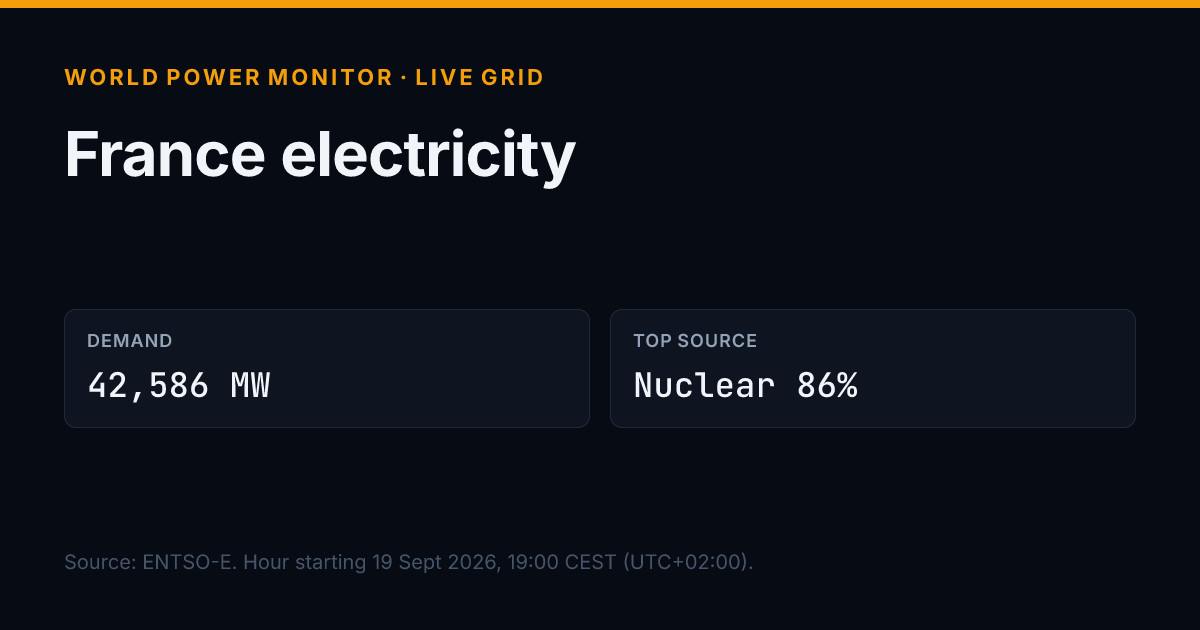
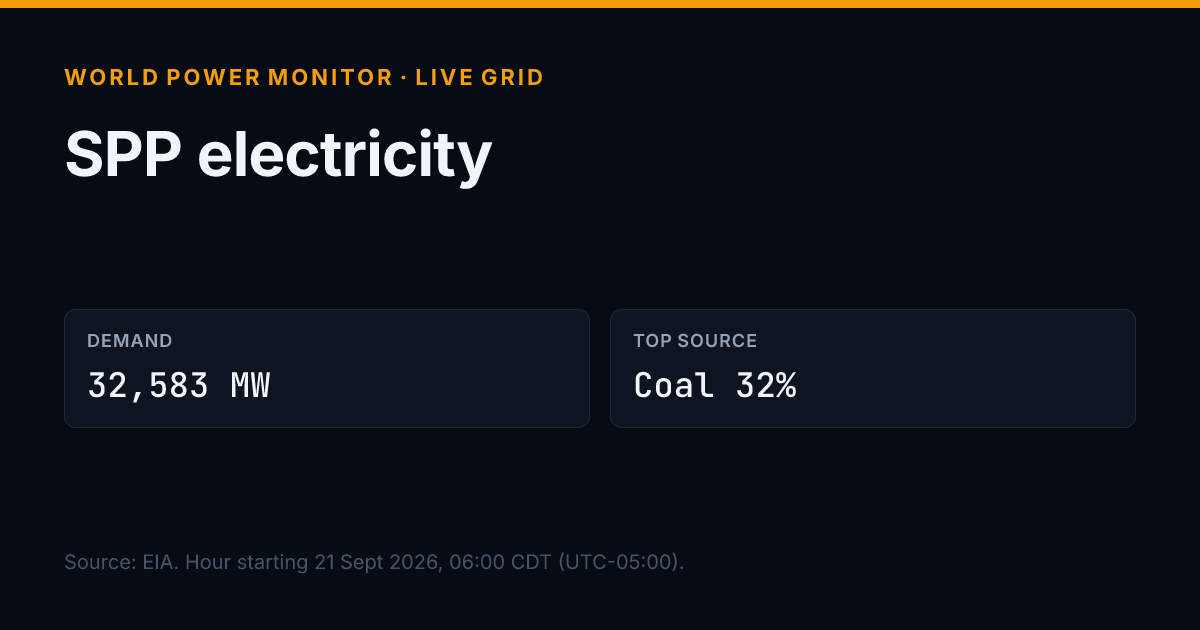
1200 x 630 PNGEach image is the card used when the page is shared, with the title, headline figures and a source line with its date built in. Copy the link or download the file. Country images show Ember annual figures. Grid operator images show operator data from EIA or ENTSO-E with their own source line, and are never combined with Ember figures.
Ten largest countries by generation, 2025
About the data
World Power Monitor keeps two layers apart. Ember's annual and monthly statistics cover every country and are revised as countries report; the figures on this page are from that layer, and the year is always named. Live operator data (EIA and ENTSO-E) covers individual grids by the hour and is shown separately, with its own source and time. Read the methodology for units, revisions and fuel categories, and the sources and licences page for every dataset.
Source: Ember (ember-energy.org), licensed under CC BY 4.0. Data as of 2025. Annual statistics.